
Basic Data Drama
Understanding data and an interesting thing about it.

The story of data started long ago, when someone figured out that text, images, tables, code, and even heavy software can be stored in a unique combination of zeros and ones. It came into effect with such great pace that in no time we could find Bill Gates on top of a pile of papers to represent the potential of this new technology!

After identifying the groundbreaking success of this marketing campaign, the world took over with a clean slate and started thinking of new ways of playing with data. Given that now data could be moved around from one computer to the other in no time, they discovered that this is quite a fun activity, and that’s how we got the data lifecycle: a simple set of steps that give an output to an input… okay a bit more than that.
Punctured Data Lifecycle
Data that we know of, data that we use everyday, data that backs our decision goes through a long process that involves many steps, 8 steps in the data lifecycle, if you want to keep it easy. These are those as how they say…
Generation → Collection → Processing → Storage →
Management → Analysis → Visualization → Interpretation
You may read through the article to know all of them, but here’s something interesting for keeping up with the present:
The data that we talk about here is generated by data producers (us + internet + some smart cameras) and gets collected in different formats. Now why do we need different formats actually? So here comes my drawing as a savior:

A simple representation of two real world situations help us understand the crucial step while storing data, how to order and categorize data? A simple answer to this is to think of the end usage of this data. For strike 1 fits well with use case 1, if you know the finite number of rows (that we generally know), and strike 2 matches well with use case 2, if you know the #people for whom you need the data.
In many cases storage needs optimization for modifying the structure of data to cater to different needs of various teams across the organization. This is where the first of many problems arise with data, more on that in upcoming articles so stay tuned!
As we see, develop, and learn about such a scenario we find that this problem affects other steps of the data lifecycle as well. So that’s where ideas started pouring in. Multiple people got passionate about so many solutions to even more/many/too many problems with this quickly scaling data industry.
We had numerous people wanting data in different formats, this gave rise to different styles of analysis which meant it also required an even farther solution for visualizing this type of data in a suitable manner. This is where chaos kicked in, when the lifecycle had issues of continuously changing requirements.
But not just this, data was also considered as gold of business value. Understanding what people want was, and still is, a big deal for everyone. And that’s where it got challenging.
Data Tool Bonanza
As people identified various limitations in scaling this lifecycle to get analytical results much faster, they poured in ideas to solve problems for niche use case of data domain. Some of the tools then proposed was Excel, Hadoop, ELT / ETL, Power BI and many more. The idea was to transform the look and feel of data, while giving it capabilities to make it look clean and understandable.
But gradually as tools came in, more tools came in. Then came some more, some more, wait a minute which one do I choose? That’s exactly what happened, and here we are, as every niche of data is now filled with a hundred tools that solve the nastiest of edge cases, without considering the layers and consumers of data
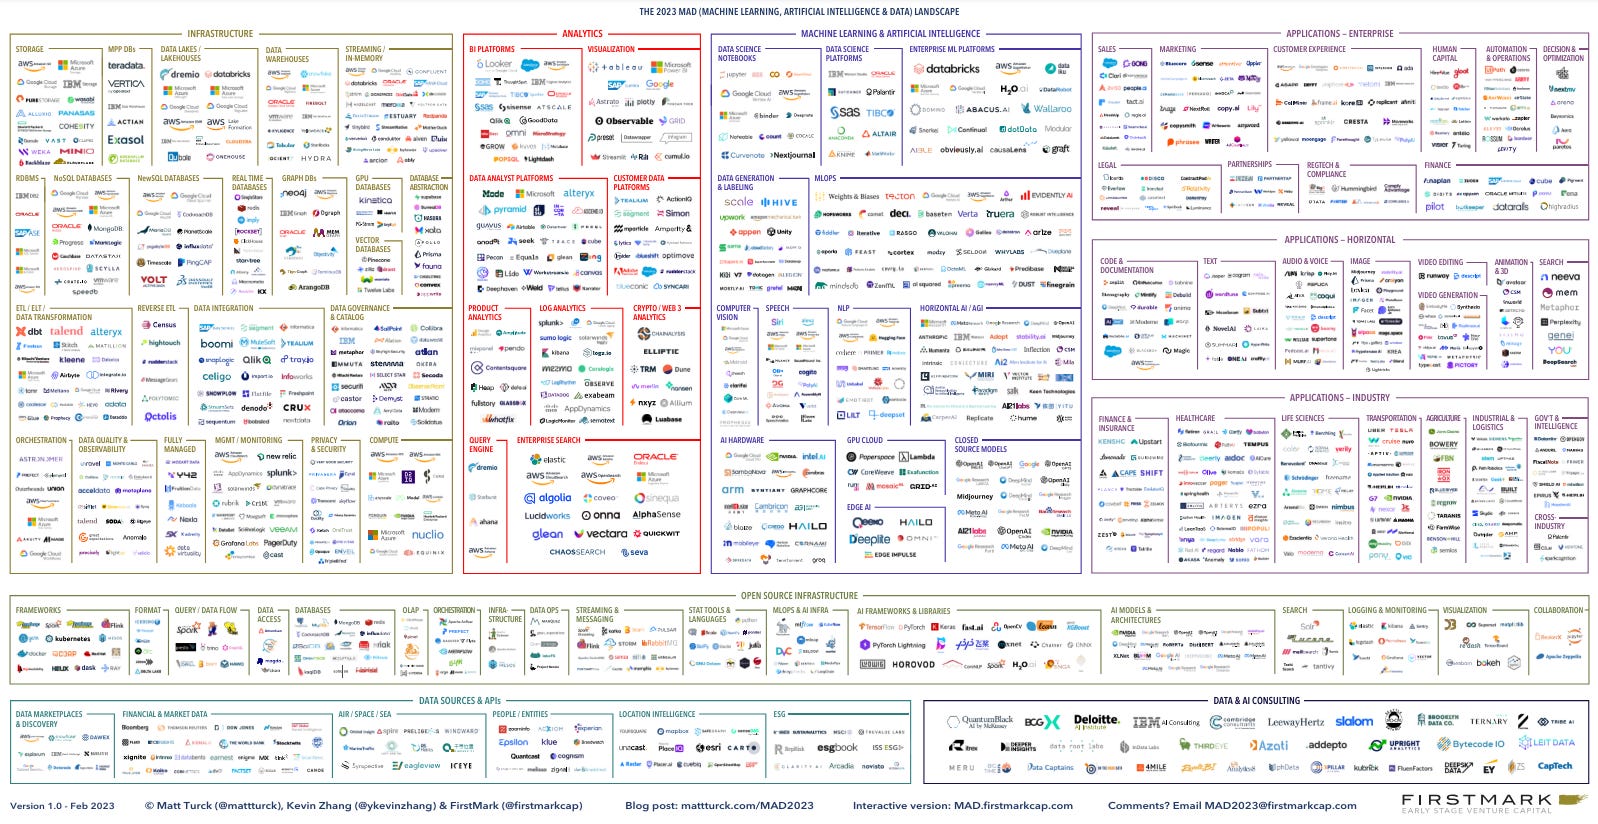
Here’s the current view of the data landscape as curated by Matt Truck, he calls it the MAD data landscape 2024 (click to see MAD landscape high fidelity interactive image)
Big Data Play
With increasing #teams that need data, to ever so dynamic requirements coming in from the business users, there often arises the problem of ‘data silos’. These not so good silos create discrepancies with data and restricts collaborations, co-operation, and context sharing between teams.
The second part is to connect integrations with your data, multiple pipelines become vulnerable and often break. More than revolving data, people often end to managing these pipelines to resolve issues in connectivity.

And most important in today’s date is the data quality. Some tools also offer AI assisted data correction, but for how long do you think a computer can replicate what a human mind thinks. Find similar and more info here, 12 Big Data issues growing companies face.
Making the organic effort work is always tough, but enhanced data quality and actual data quality drastically differ in real life. As slowly this idea takes a mature turn, we can also expect data to be considered a necessity before speaking because it has now become so much accessible.
Going Retro
The Idea of writing this article came as a side-thought. I want to bridge the gap and narrate a story of how data became everything, coming from nothing. So stay tuned, this is going to be a story mode narration where the hero is data, and the storyteller is a human creating more data (me). You know the drill…
Stay tuned. Connect with me on LinkedIn and Twitter for more data drowsiness.